Stocks have stumbled into October with the S&P 500 down about 6% as I write this. The source of equity investors’ angst is always hard to pinpoint and this is no exception but this correction doesn’t seem to be due to concerns about economic growth. At least not directly.
The most common explanation for the pullback in stocks – 6% doesn’t even qualify as a correction – is rising interest rates but I think it is a bit more complicated than that. Asset prices are obviously impacted by the discount rate applied but they are also driven by expectations regarding the stream of cash flow they generate. Changes in either – or both – can cause a change in investors’ perception of the value of the asset. The discount rate has obviously risen lately and the Fed has been about as clear as it ever is that the rates over which it has control will continue to rise.
But as I said in my Global Asset Allocation update, I think the more relevant factor, in this case, is the cash flow or earnings. What is interesting though is that while stock investors seem concerned, bond investors seem to be saying that whatever is driving earnings expectations won’t have an impact on growth or inflation. I suppose that could be true in the short term but I don’t think it will in the long term. If tariffs reduce corporate profits, they will eventually impact overall economic growth.
Still, the fact is that it is hard to find much to worry about in the economic statistics or the market-based indicators we follow. The housing market is the most obvious weak spot right now but that sector has diminished in importance in recent years. Could a weakening housing market be sufficient to pull us into recession? If it is that alone, I think the answer is no. If the implosion of the fracking industry a couple years back wasn’t enough to do it, I doubt housing would either.
It is important to remember that stock prices are more volatile than bonds and move pretty independently of the economy in the short run. Emotion is more important than facts and about all I can say for sure right now is that fear is winning out over greed right now when it comes to risk assets. I believe the source of the fear is the impact of tariffs but to be honest with myself I don’t know that to be true. That could be my own bias showing through. Maybe investors are concerned about the election or Italy or Saudi Arabia or all of the above. But they are worried for sure.
As an investor, it is important not to overreact to every squiggle in the stock market. Our review this month shows that the economy hasn’t changed all that much and so neither should the long-term outlook for stocks. The Fed has talked repeatedly about “normalizing” interest rates and they are well on their way to doing so. The volatility we are seeing in stocks is also a return to normal. Corrections of 10 -20% are normal and should be expected. Bear markets, on the other hand, are usually driven by economic changes – recession. And right now, the odds of recession remain low.
Economic Reports
Economic Growth & Investment
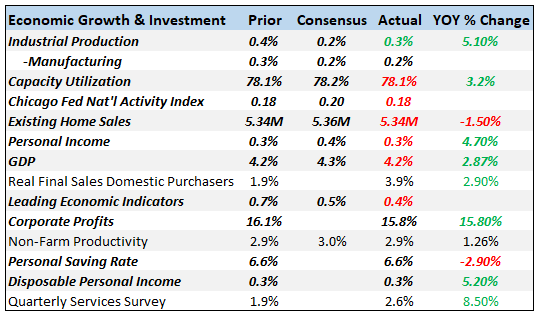
The Chicago Fed National Activity index is one of the broadest indicators we follow and it continues to show an economy growing slightly above trend. The three month average for the CFNAI is 0.24 where a reading of zero indicates growth at trend (which is around 2.3% right now). While the economy does not appear to be in danger of falling into recession, neither is it ready to boom, the President’s claims notwithstanding.
Probably the most worrying stat in this group is the existing home sales number. The housing market is just struggling right now. The limiting factor is hard to pinpoint but is probably a combination of rising mortgage rates, high prices, slow income growth and high debt levels, especially among first time buyers.
The personal income and disposable personal income reports are pretty pedestrian and continue the slow growth we’ve seen this entire expansion. The growth rates aren’t terrible but they aren’t great either.
Corporate profits are up 15%+ but that is double the pre-tax growth rate due to the cut in the corporate tax rate. The pre-tax rate of 7.3% is a better estimate of actual activity. Profit margins are at all-time highs right now but I’m skeptical that can be maintained as cost structures come under pressure from supply chain disruptions due to tariffs.
Production
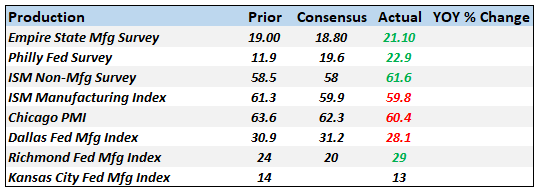
Hard data – actual results – continues to lag these sentiment surveys. Sentiment is, however, a coincident indicator and provides little insight about the future.
Consumption & Distribution
Retail sales were not very good but there are likely some hurricane effects here from Florence. Gas station sales were down 0.8% and restaurants were down an even harder 1.8%. Both of these were likely affected by Florence. With another hurricane hitting the Florida gulf coast recently it will probably be several months before we get a “clean” number. Year over year rates are in the “okay but not great” category as they have been this entire cycle. Motor vehicle sales rebounded back above the 17 million SAAR but there are probably some hurricane effects in that number as well.
Inventories
Inventories have been building as companies try to minimize the tariff impact but sales have been good enough to keep the inventory/sales ratios steady. I/S ratios had been falling though and are still above the lows of this cycle.
Orders
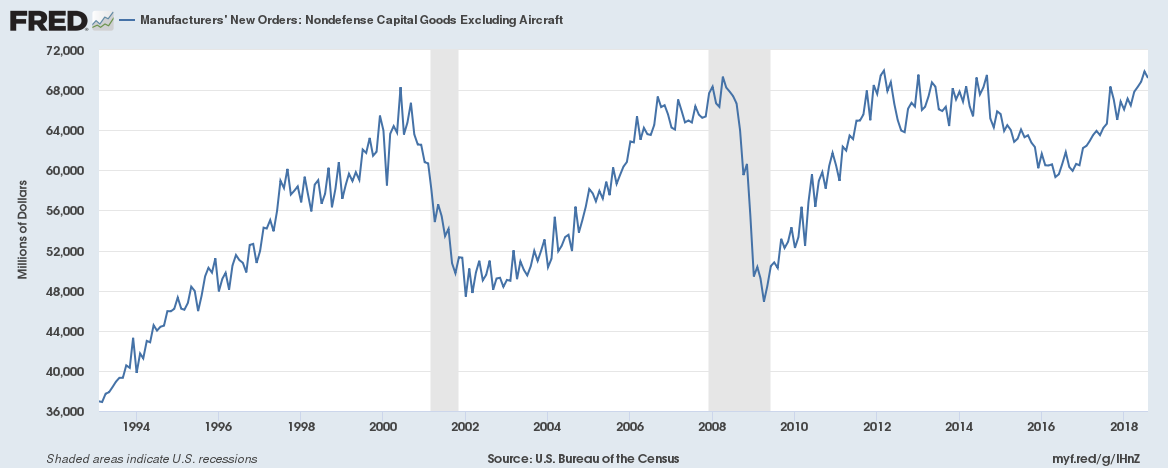
Headline factory orders were better than expected but that was all aircraft (read Boeing). Ex-transportation, orders were only up 0.1%. Durable goods orders were also disappointing, particularly the core capital goods number. The factory order report revised that down further to -0.9%. Capital goods orders have been rising and the year over year rate looks positive but the current level is no higher than it was in 2000 and 2008 right before those recessions. Core capital goods orders that are no higher than they were 18 years ago, in an economy that is quite a bit larger, is not a good sign for the economy. Economic growth is about productivity and workforce growth. Given the current administration’s views of immigration you probably shouldn’t expect much from the latter. Productivity is about investment – capital goods – and if this is as good as this gets, we won’t see much on that front either.
By the way, I don’t think a lot of people are aware of how bad the 2014-2016 slowdown really was. Our Jeff Snider took a lot of grief for being so negative but a quick glance at the chart above should be sufficient explanation. The worst of the drop in core capital goods was in the second half of 2015 at about -9% yoy. That’s comparable to March 2001 or November 2008 in the last two cycles. In other words, Jeff had very good reason to be worried. But there are no absolutes in economics, some level or rate of change in core capital goods orders that guarantees recession. In this case, we avoided recession but there was plenty of reason to be concerned about a different outcome.
Trade
I don’t think these numbers are what President Trump was aiming for with tariffs. Exports are falling and imports are surging, the trade deficit getting worse. In fact, a lot worse. But the surge in the trade deficit is mostly about short term tariff distortions. The timing of exports and imports are different than they would have been absent the tariffs and the threats of more. In other words, these reports are next to useless for determining anything about the economy today or in the future.
Inflation
It is hard to find a reason for the Fed to keep hiking rates in these numbers. Inflation, at least for now, is moderating. Even housing is starting to behave, as lagging sales are limiting price increases. Outside of housing the highest rates of inflation we see are in import prices. Behold the power of tariffs.
Employment
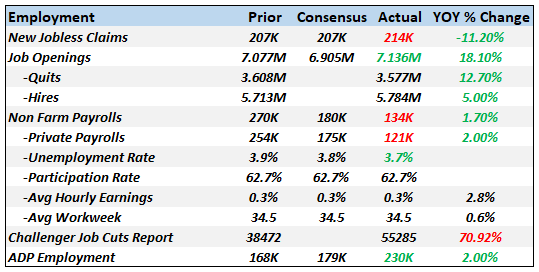
Job openings in the JOLTS report continue their upward swing and show an economy that is hitting on all cylinders. Unfortunately, it stands nearly alone in that characterization of the economy. Even the rest of the JOLTS report is not that positive. Quits actually fell last month and hires aren’t as positive as the official employment report which was itself not that great. There seems little doubt that there are areas of the economy suffering from a lack of workers but the lack of real wage growth would seem to indicate that it isn’t widespread.
The most negative report here is the Challenger layoff report which shows a nearly 14% rise in large layoffs in the first nine months of this year versus last. Some large fraction of the recent increase is from Wells Fargo but Ford has also announced layoffs recently. That will probably show up in the next Challenger report.
The labor market is pretty good but temper your enthusiasm.
Construction
Starts, permits, construction spending and new home sales all showed disappointing results. There is little doubt that the housing market is slowing although some of the most recent numbers may be distorted by Hurricane Florence. But the trends are pretty well established and the hurricane didn’t change them. I would not expect to see any contribution to GDP growth in the most recent quarter from residential investment.
Sentiment
Sentiment remains buoyant but as I’ve said many times that means nothing other than people are feeling pretty good right now.
Market Indicators
10-Year Treasury Note Yield
Well, 3.25% was my target and it has now been met. Will it prove to be the top? I have no idea but with housing cooling, core capital goods order growth fading, exports falling, inflation benign, monthly payroll growth slowing and tariffs starting to bite, I wouldn’t bet against it. The Fed is very confident that it will be hiking rates well into next year but I’m not so sure. A lot of economic activity, especially in this quarter, has been pulled from the future as companies and individuals try to get ahead of tariffs, actual and prospective. I can’t quantify that but it is real and affecting a variety of economic series. Technicals matter though and with rates breaking out above previous resistance, I think you have to give the benefit of the doubt to the rate bulls.
10-Year TIPS Yield
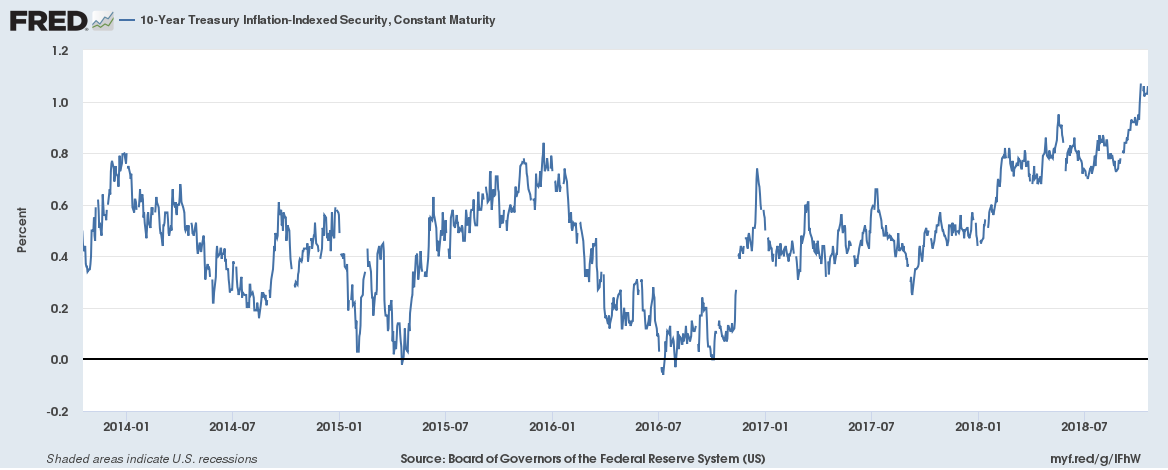
TIPS yields have finally moved above 1%, a level not seen since early 2011. The rise in TIPS yields is a positive sign for growth but the current level is still quite low. In the previous business cycle, the 10 year TIPS yield stayed mostly between 1.5 and 2.75%. It is our view that until real yields get back at least to those levels, the economy cannot be said to have truly recovered. Higher real rates would be an indication of rising investment and future productivity gains. Things may be marginally better but we still have a long way to go.
2-Year Treasury Yield
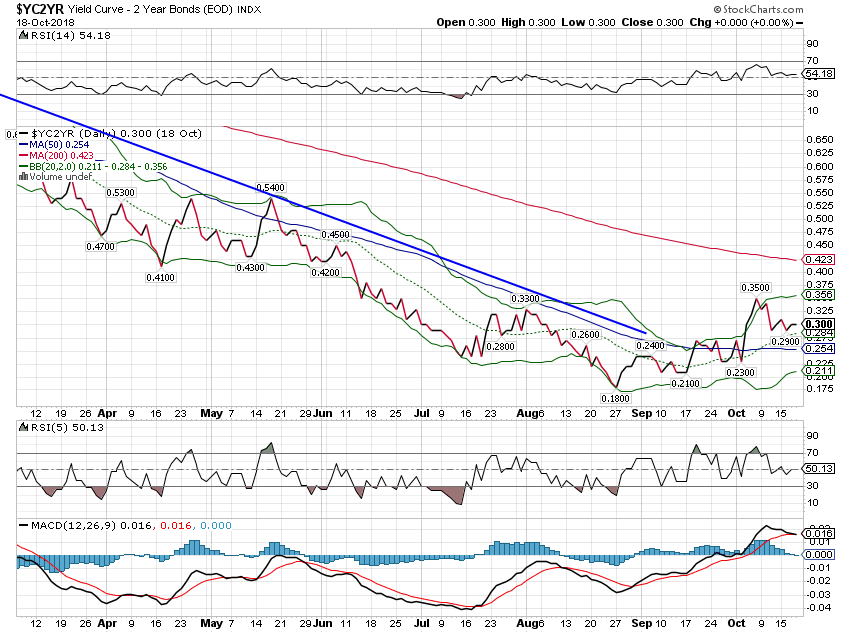
2 year yields continue to rise, reflecting expectations regarding Fed policy. The Fed head talkers have been surprisingly hawkish recently and a December hike is already priced in.
10/2 Yield Curve
The 10/2 curve has steepened recently but in a good way. In the mixed up world of bond trading this is known as a bear steepener, where long rates rise faster than short rates. Many times this is seen as an indication of rising inflation expectations but as we just discussed with regard to TIPS, the recent rise in long rates has been about rising real growth expectations. So this steepening is an indication the market believes growth is accelerating. I can’t really see it in the data yet but as I’ve said many times, I pay more attention to markets than economic stats. Why is the market boosting growth expectations? That I don’t know and it isn’t a big change in any case. The longer term trend of the yield curve is still flatter.
Credit Spreads
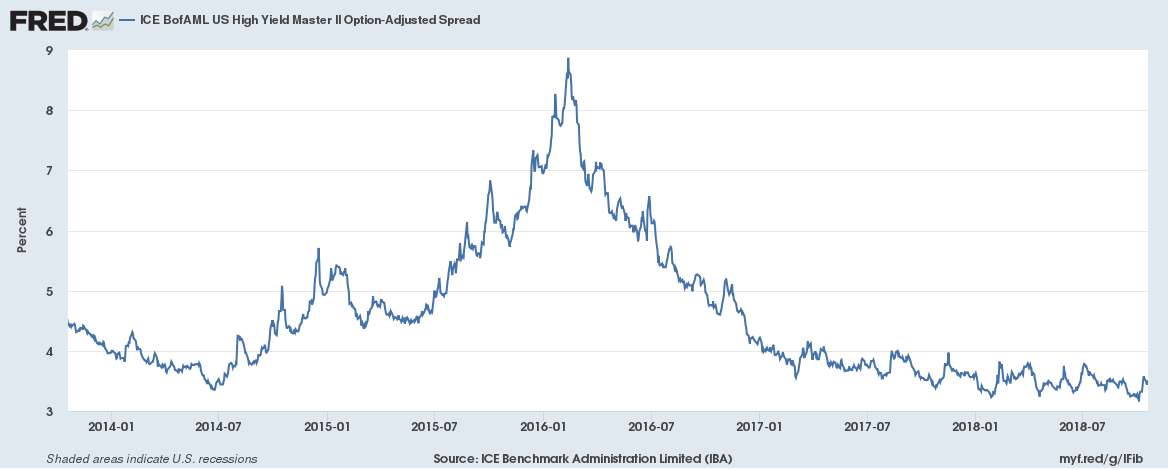
Credit spreads made new lows for the cycle and then sold off. Still the trend is obvious and spreads show no sign at all of stress in credit markets.
US Dollar
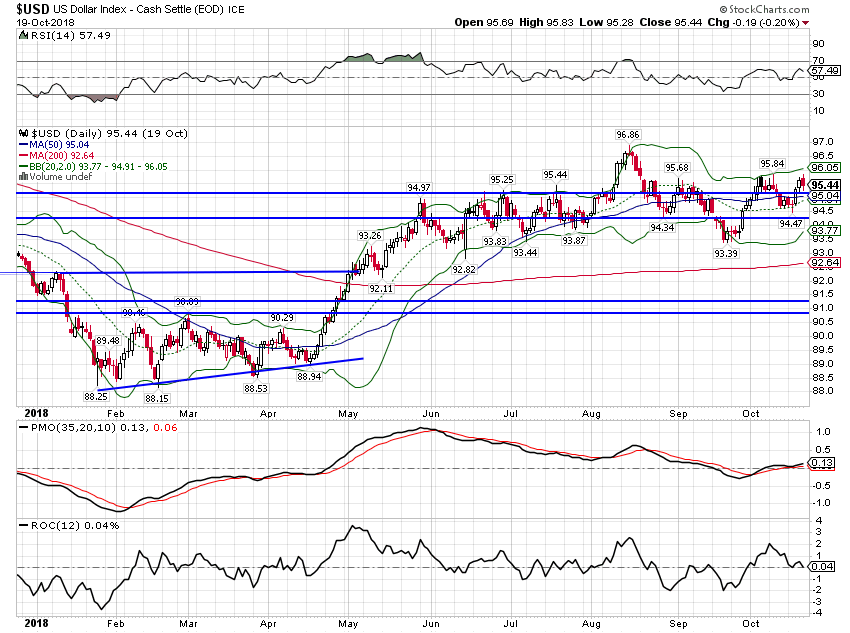
The dollar index moved up very slightly over the last month but there is little momentum in either direction. The narrative driving markets has been that the US economy is a lot better than the rest of the world but if that were so, the dollar would likely be rising rather than struggling against the likes of the Euro. Dollar strength has really been mostly about emerging market currencies.
EM Currency ETF
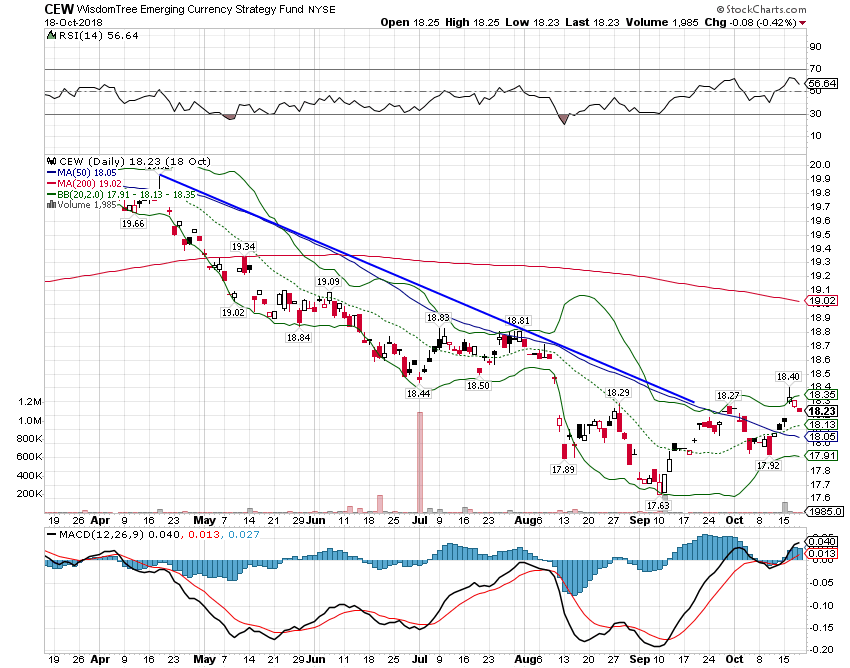
As I said last month, we are seeing more differentiation in the EM currencies. The real weaklings have been Turkey, Argentina, China and India (although India is seen as still relatively healthy compared to the others). The rest of the EM currency bloc appears to have stabilized.
Commodities
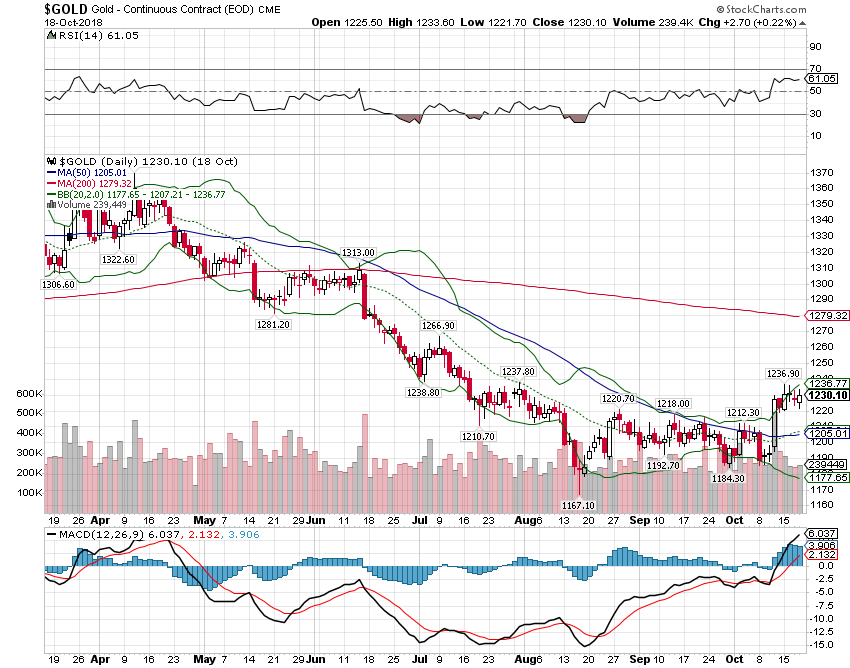
Gold has been trading more firmly recently despite those higher US growth expectations.
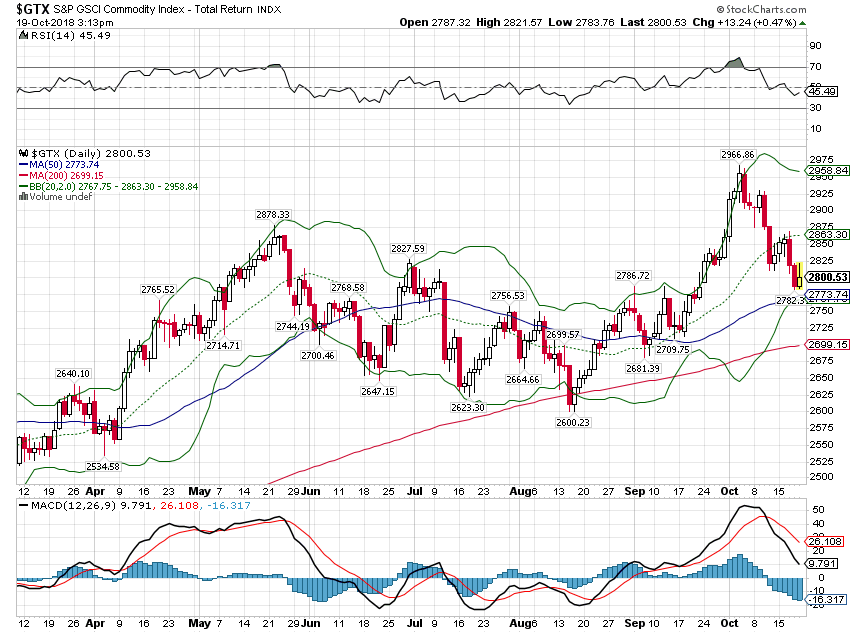
The more general commodity indexes have sold off with stocks. The GSCI is very sensitive to energy prices and has corrected as crude prices have backed off. Still, the index is higher since my last update.
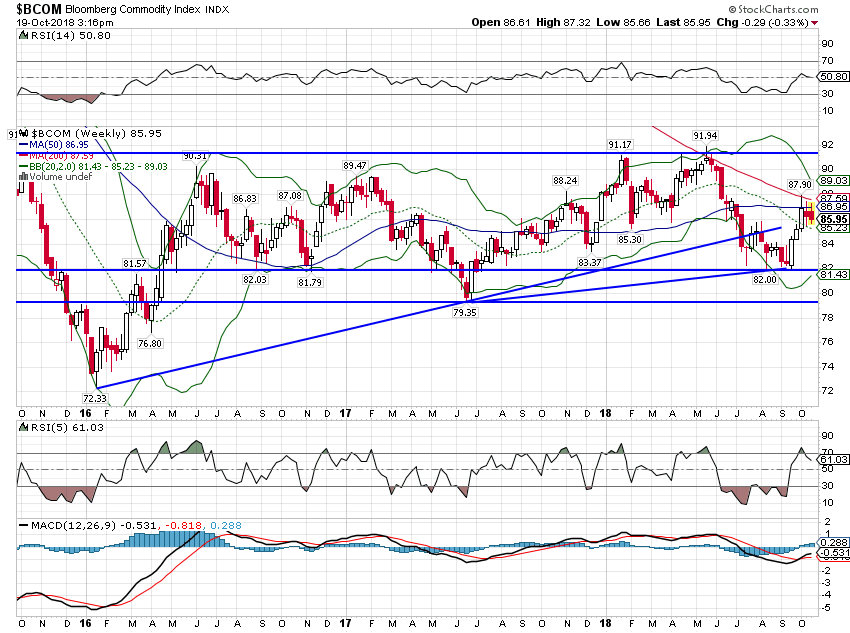
The more diversified Bloomberg commodity index has performed better but is still off its highs. Commodity prices are sensitive to growth expectations and this is another indication that the equity sell off is not being driven by growth fears.
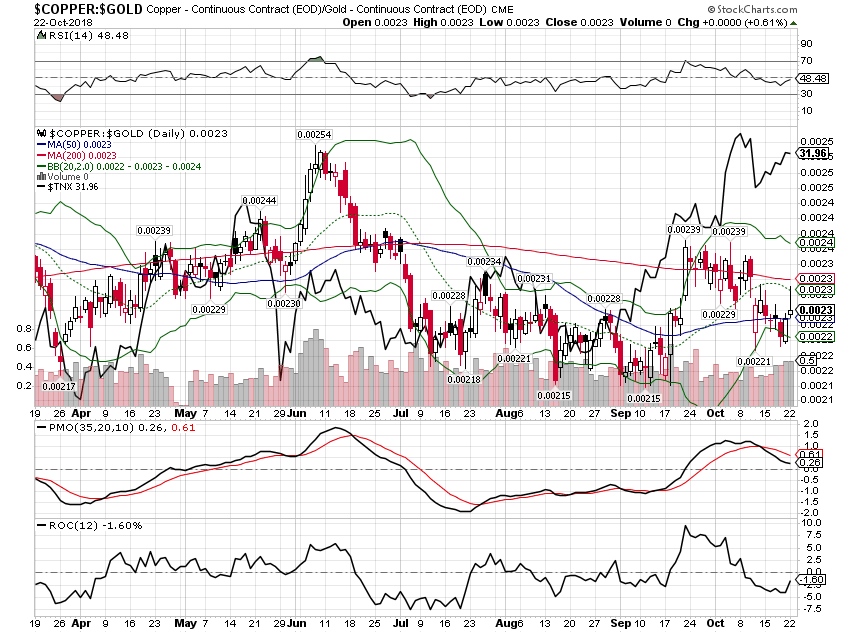
The copper to gold ratio points to “risk off”. Bonds have so far resisted the message of the commodity markets but if this ratio continues to fall, bond yields will probably follow.
Stocks are not correlated with economic growth in the short term, something investors may need to learn again now that interest rates are off the floor. The economy has been growing slightly above trend since the election of President Trump but there are a lot of one time factors involved in raising growth from the low 2% range to the high 2% range. The tax cuts goosed corporate profits this year but we won’t get another cut next year; underlying earnings growth is still mid to high single digits. Individual tax cuts will have a more permanent impact but the changes were fairly small. And the tariffs have pulled forward some activity from the future but that will end as well no matter what happens with negotiations. I think it is more likely – maybe much more likely – that growth falls back to the previous range than accelerates. I’d love to be wrong but for now there isn’t anything in the data or the market to suggest otherwise.


