
Most everyone has heard of the Chinese proverb – or curse – that wishes one to live in “interesting times”. You’ve probably also heard that in Chinese the word “crisis” is composed of two symbols, one that denotes “danger” and another that means “opportunity”. Well we certainly live in interesting times and there is indeed a crisis. We won’t know if it was an opportunity until sometime in the future but if the stock market is any indication there are certainly a lot of folks who see it that way.
In the last two months 36 million people have filed for unemployment benefits and the official unemployment rate has risen from 3.5% to 14.7%. Retail sales were down nearly 17% from March to April and 21.6% year over year. Open Table recently estimated that one quarter of US restaurants will go out of business because of the virus. GDP estimates for the current quarter range from awful to frightening. Recession? Depression? I don’t know, but it isn’t good.
In the midst of all this economic carnage one would expect stocks to fall and they did with the S&P 500 down 35% at its low in late March. But just two months later stocks have recovered a large portion of those initial losses. The S&P is now down just 12.5% from its February highs and just 8% year to date. Even more amazing, the NASDAQ 100 is only a fraction below its all time high and is actually up over 8% year to date.
So, what gives? How did stocks recover so quickly when the outlook for the economy remains so murky? Markets look ahead so stocks may be discounting a rapid recovery from the virus induced contraction. That narrative, however, is not consistent across markets. The 10-year Treasury note is trading with a yield of roughly 0.7% and the 30-year rate is less than 1.5%. 10-year TIPS trade with a “yield” of negative 48 basis points. The bond market certainly isn’t looking for a rapid turnaround.
Stocks aren’t completely alone. Crude oil has recovered from its April, near death experience with negative prices, up $70 from the lows. There’s still oil in floating storage offshore but demand is rising and supply has been cut (by the market, not some agreement at OPEC+). Copper prices have also firmed recently, up 25% from the lows.
Still, no market is as ebullient as equities and one can’t help but wonder what exactly is driving this urgency to buy stocks. The idea of a “V” shaped recovery is tempting but far from the sure thing stock buyers seem to treat it as – if that’s even what stock buyers really believe. Based on my very unscientific method of watching a lot of CNBC and Bloomberg, reading a lot of tweets, articles and blog posts and talking to a lot of individual investors, “V” recovery types aren’t exactly thick on the ground. I would put the vast majority of people in the “U” recovery camp, with the “L” camp occupied by the familiar coterie of bears.
But online brokerage firms are opening record numbers of new accounts, a phenomenon that started late last year. The surge in new accounts started last year when the industry shifted to zero commission but that doesn’t seem sufficient to account for the surge in recent stock market interest. TD Ameritrade opened over 600,000 new accounts in the first quarter. ETrade added 363,000 and Schwab a record 609,000. Robinhood, the favorite of millennials, saw record deposits in the quarter.
A more likely explanation is the surge in stock prices last year, particularly in the NASDAQ 100. The NDX gained 38% in 2019 and continued the run in the new year, rising a total of 53.5% from 12/31/2018 to the peak on 2/19/20. There is nothing like a surge in stock prices to bring in new “investors” who want some of that easy money all their lying…er…golfing buddies claim they’re making.
Trading volume started to pick up last year after commissions were cut but took off in March and April. Of Charles Schwab’s top 30 trading volume days of all time, 27 of them came in February and March. Robinhood and ETrade both reported triple the trading volume of a year ago in March and a continued upswing in April. TD Ameritrade did 3 million trades a day in April, up from about 800,000 a year ago.
Most of these new traders are on the buy side with firms reporting buy/sell ratios of roughly 1.5/1. Option trading volumes are also surging and small traders are overwhelmingly bullish. Traders of small lots (10 contracts or less) are opening bullish positions at a rate of almost 5 to 1, a record as far as I can tell. Another sign of rampant bullishness is the equity only put/call ratio which recently fell below 0.5.
The popular explanation for the surge in stocks – and expectations of a “V” recovery – is the government response to the virus crisis. The Fed is buying everything that isn’t nailed down and Republicans and Democrats have finally found common ground in spending money we don’t have. The Fed’s actions in particular are given a lot credit for the stock market surge as the popular perception is that they are “printing money”. Gold’s surge seems to support that view. But it is far from that simple and those who assign credit to the Fed apparently have very short memories.
When QE1 and 2 were first introduced and implemented there was a lot of fretting about the inflationary implications. Gold rallied from $700 to $1900 before everyone finally figured out that inflation just wasn’t coming. Although most don’t remember it now, QE didn’t do much for stocks initially. QE1 started in December of 2008 but stocks fell another 26% until March of 2009 when mark to market accounting was finally killed. Stocks did rise as the Fed’s balance sheet expanded though and the correlation was much remarked upon. But, as they say, correlation is not – necessarily – causation.
The economy of the 2010s grew at a subdued pace – secular stagnation – but it did grow and a rising stock market makes perfect sense in that context. The bearish argument for nearly a decade has been that stocks are expensive, a function of Fed actions that artificially suppressed bond yields. The problem with that explanation is that stocks continued to rise after the end of QE and even as the Fed raised rates starting in 2015.
If Fed policy isn’t the source of the high valuations, what is the cause? The explanation is not found at the Fed but rather at the Treasury. We have had two periods of high valuation in the last 25 years and both featured a strong dollar. Price to earnings ratios follow the dollar not the Fed.
The late 90s period saw the dollar index rise 25% from 1995 to the end of 1999 and the price to earnings ratio of the S&P 500 doubled in that time.
The P/E ratio of the S&P 500 rose in the late 90s along with the dollar (blue line).
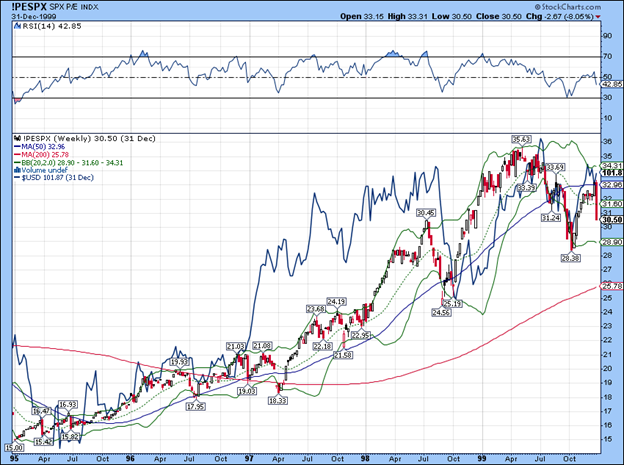
Strong dollar periods are marked by increased investment in intellectual assets (equities). Real assets suffer a dearth of investment amid low prices. The late 90s are a perfect example as stocks soared and commodities hit multi-decade lows. Copper fell to $0.61 in late 1999 and crude oil fell to $11/barrel. Both of these are considered economically sensitive assets and yet, even in a strong growth environment, their prices fell because of the strength of the dollar.
Part of the explanation for this is just momentum. Assets that are rising in price tend to attract more buyers and those falling in price are shunned; capital flows to where it is treated best. A strong currency policy, such as that promoted by Robert Rubin in the 1990s, attracts capital which in turn pushes the currency higher which attracts more capital and so on. And that capital needs to be invested.
After the dot com crash capital continued to flow to the dollar but in a recession, bonds received the bulk of the inflows. In the weak dollar period that followed, P/E ratios fell in line with the dollar.
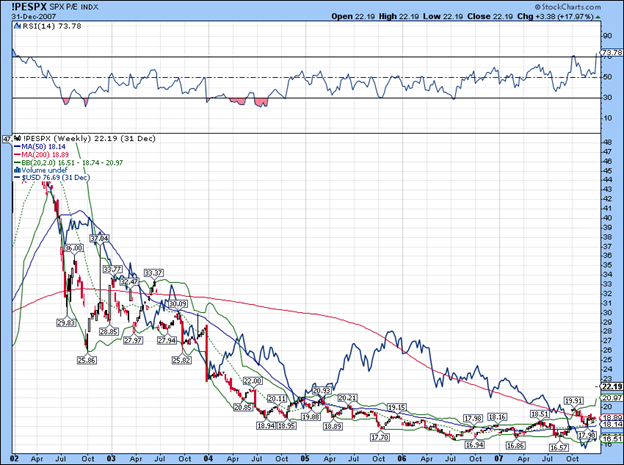
During the 2008 recession, as in the previous one, the dollar rose and bonds rallied. After the recession, the dollar traded in a volatile range before finally bottoming and starting a steady rise in 2012. And a rising dollar again raised stock valuations until the dollar peaked at the end of 2016 with President Trump’s election.
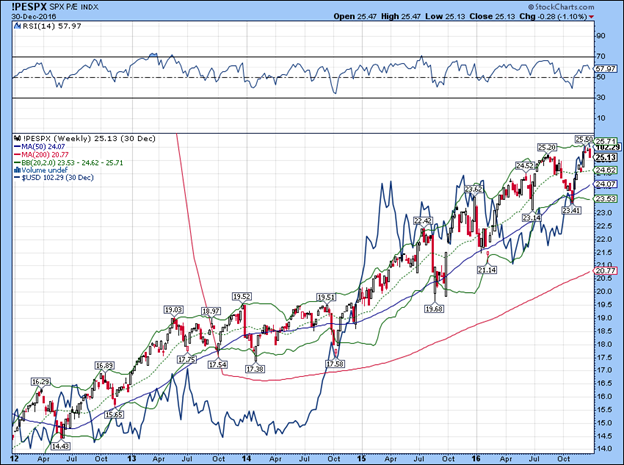
The rally in stocks in 2019 and into early 2020 was also marked by a rising dollar. From its 2018 lows the dollar index rallied nearly 14% and stocks dutifully followed right along. Indeed, the dollar started rising before stocks which supports the idea that it is capital flows driving the stock market and not the Fed.
But what are we to make of the current enthusiasm for stocks in the face of the COVID-19 threat? Well, I don’t know whether we will get a “V” shaped recovery and neither does anyone else. The people betting on that outcome via the stock market are speculating. They may be proven right or wrong, but widespread speculation during a strong dollar period is normal. We saw it in the late 90s when normally sane people were quitting their jobs to day trade.
When there is a lot of capital chasing a finite number of shares, prices tend to rise and in the virus era the number of stocks deemed worthy of investment has shrunk even more. There’s a reason that stocks like Amazon and Microsoft are trading at a premium to the market. So, yes, stocks are expensive, especially if the US recovery is not as quick as the optimists hope. Stock prices will probably have to adjust lower despite a fairly strong dollar if the recession persists. But, make no mistake, the long-term threat to stock prices is the dollar. If the dollar starts to trend lower, stock valuations and stock prices will too. There’s an old saying attributed to Mark Twain that says “it ain’t what you don’t know that gets you in trouble. It’s what you know for sure that just ain’t so.” Despite it being attributed to Twain, there is no record of his ever having said it. There is also no evidence of the “Chinese” proverb I cited at the beginning of this essay. Nor does the Chinese symbol for crisis represent danger and opportunity. Just because everyone believes something doesn’t make it true.


