
Housing starts and building permits both rose in June:
Building Permits
Privately-owned housing units authorized by building permits in June were at a seasonally adjusted annual rate of 1,446,000. This is 3.4 percent above the revised May rate of 1,399,000, but is 3.1 percent below the June 2023 rate of 1,493,000. Single-family authorizations in June were at a rate of 934,000; this is 2.3 percent below the revised May figure of 956,000. Authorizations of units in buildings with five units or more were at a rate of 460,000 in June.
Housing Starts
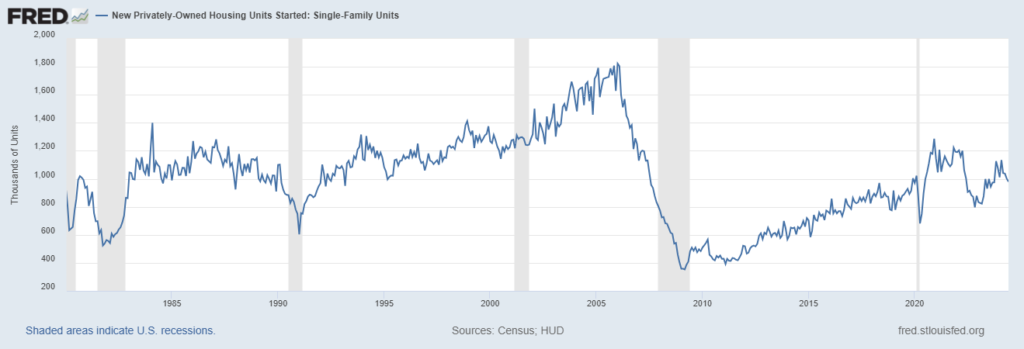
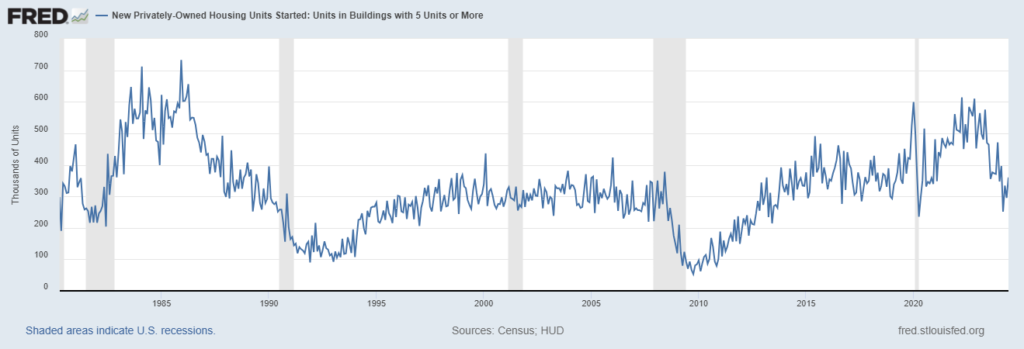
Privately-owned housing starts in June were at a seasonally adjusted annual rate of 1,353,000. This is 3.0 percent (±10.5 percent)* above the revised May estimate of 1,314,000, but is 4.4 percent (±12.7 percent)* below the June 2023 rate of 1,415,000. Single-family housing starts in June were at a rate of 980,000; this is 2.2 percent (±12.1 percent)* below the revised May figure of 1,002,000. The June rate for units in buildings with five units or more was 360,000.
Despite this small rebound, single family and multi-family housing starts are still in a downtrend.
Completions rose much more than starts:
Housing Completions
Privately-owned housing completions in June were at a seasonally adjusted annual rate of 1,710,000. This is 10.1 percent (±10.6 percent)* above the revised May estimate of 1,553,000 and is 15.5 percent (±12.6 percent) above the June 2023 rate of 1,480,000. Single-family housing completions in June were at a rate of 1,037,000; this is 1.8 percent (±10.3 percent)* above the revised May rate of 1,019,000. The June rate for units in buildings with five units or more was 656,000.
These trends have been in place for months and the result is a rise in the inventory of new homes:
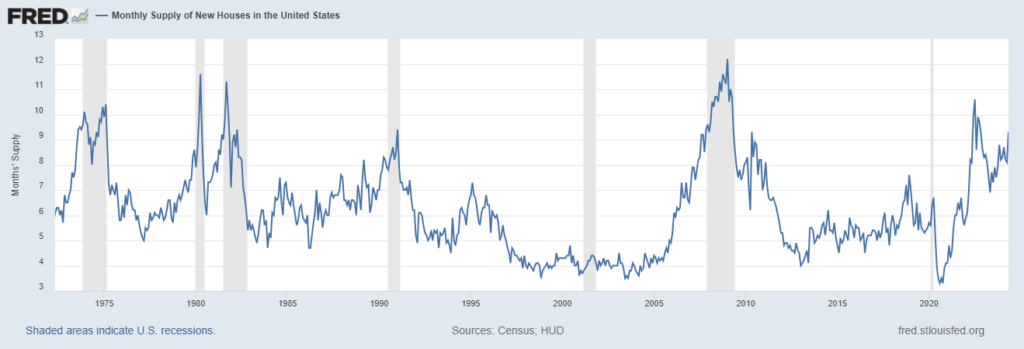
The National Association of Homebuilders (NAHB) tries to make it seem okay:
“In the Census May 2024 newly built home sales data, the current months’ supply of inventory is 9.3. Some analysts have noted that, given the five- to six-month benchmark, that this means the building market for single-family homes is possibly oversupplied, implying declines for construction and prices lie ahead.
However, this narrow reading of the industry misses the mark. First, it is worth noting that new home inventory comprises homes completed and ready to occupy, homes currently under construction and homes that have not begun construction. That is, new home inventory is a measure of homes available for sale, rather than homes ready to occupy. In fact, just 21% of new home inventory in May comprised standing inventory or homes that have completed construction (99,000 homes). (High New Home Inventory: What it Means for Home Building).”
What they don’t tell you is that 99,000 is a 14 year high. They also try to justify the high inventory by citing low existing home inventory but that will only remain true for so long.
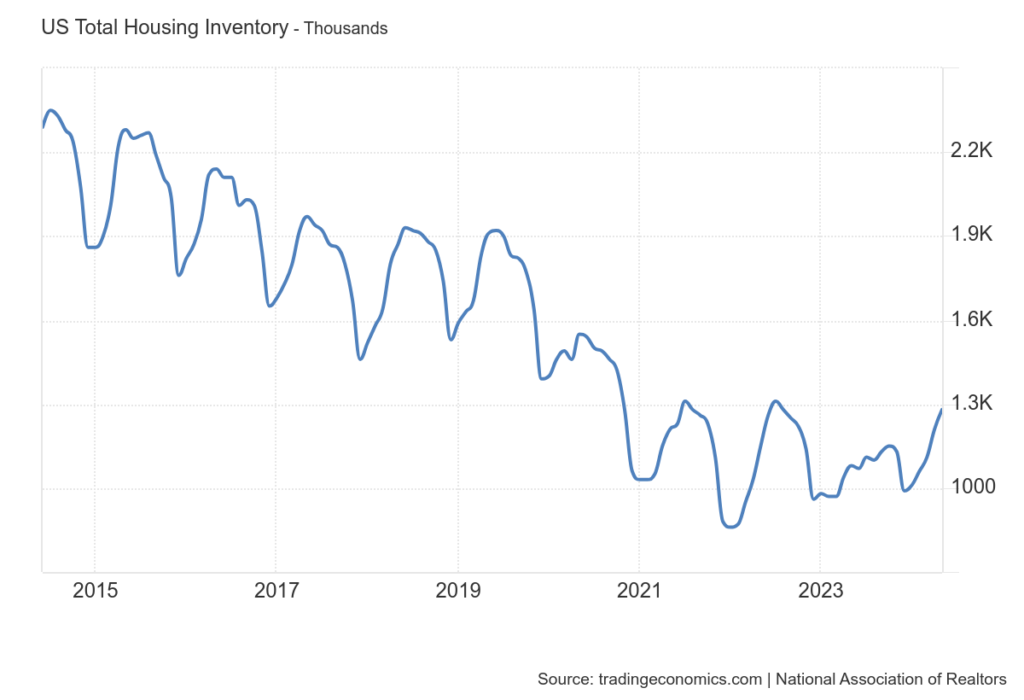
Overall inventory remains fairly low but it is starting to recovery:
Commentary
If mortgage rates continue to come down the effect on the housing market may not be what people expect. In general, homebuilder stocks tend to do well when rates are falling but this cycle the opposite has been true. Why? Because so many people locked in low rates during COVID that no one is willing to move and take on a higher rate, pushing down existing home inventory to very low levels (currently just 3.7 months of supply). So new homes had little competition and homebuilders took advantage. But as is often the case in the construction industry it appears they have gone overboard.
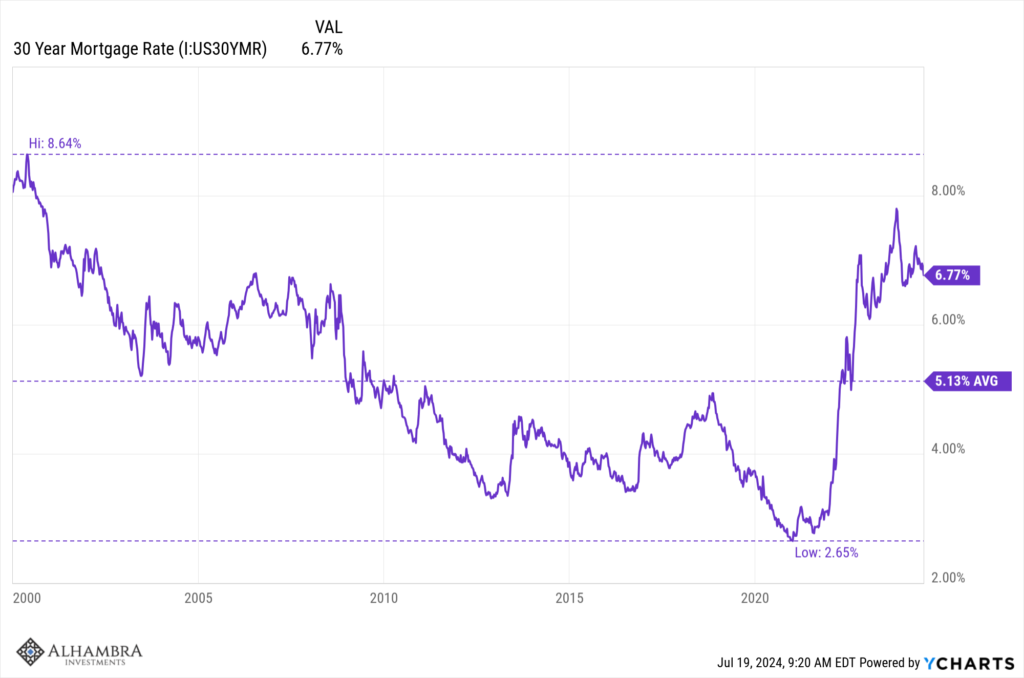
Mortgage rates have room to drop significantly even without a drop in other interest rates. The spread over the 10 year Treasury rate has been and still is elevated. The 30 year mortgage rate is currently 6.77% while the average since 2000 is 5.13%.
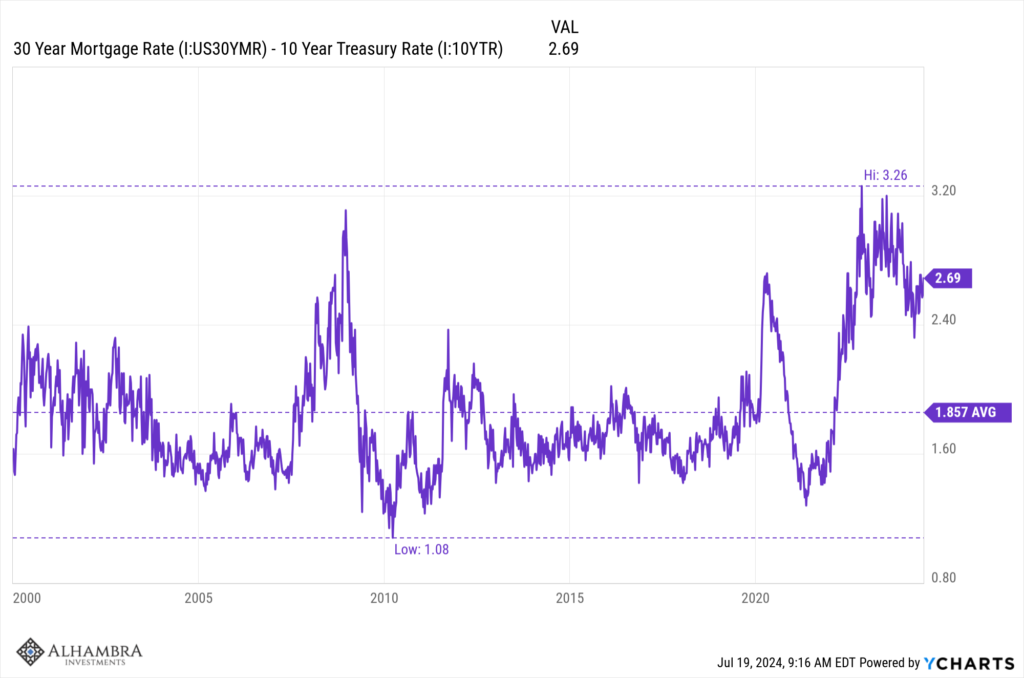
The current mortgage rate is elevated not just relative to the long term average but also relative to the 10 year Treasury rate. The spread to the Treasury yield has averaged 1.86% since 2000 but is currently 2.69%. If the spread falls to the long term average, the mortgage rate could fall to 5.94% even if the 10 year Treasury rate is unchanged.
As mortgage rates normalize, existing home inventory should rise as some homeowners with lower mortgages find it acceptable to move and take on a slightly higher rate. That will provide more competition for new homes at a time when inventory is already at a 14 year high. We would also expect the demand for housing to rise as mortgage rates fall since that is effectively a price cut.
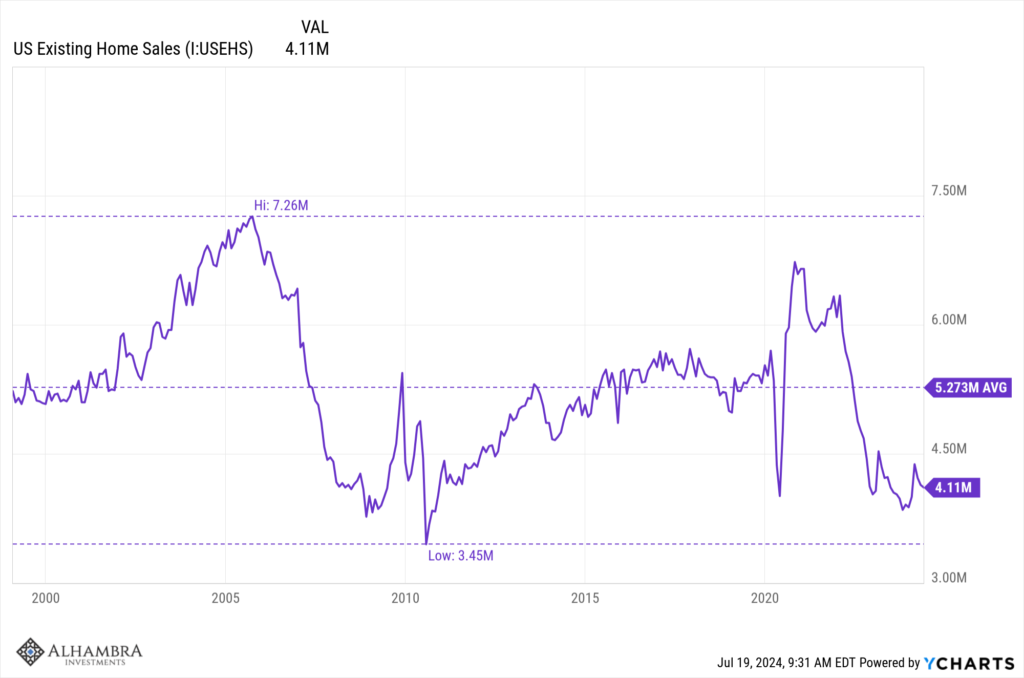
Existing homes are currently selling at 4.11 million annual rate, well below the 5.27 million rate average since 1990 (I used 1990 as a starting date to account for the housing boom and bust in the ’00s).
Will current owners offer enough houses to the market to meet demand if mortgage rates fall? The answer to that will determine whether homebuilders have been too aggressive in building inventory. That isn’t something that can be calculated in advance but the outcome will be evident in home prices as supply and demand interact.

